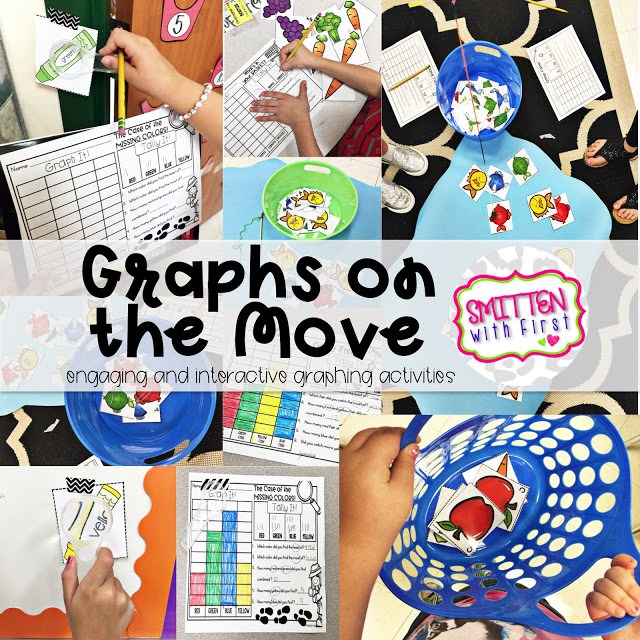
This week we wrapped up our graphing unit. If you missed our bowling graphing activity from last week, you can read about it here. Our math time falls right after lunch, so getting my students up and moving is a must! This week we became detectives, grocery shoppers, and we even went fishing.
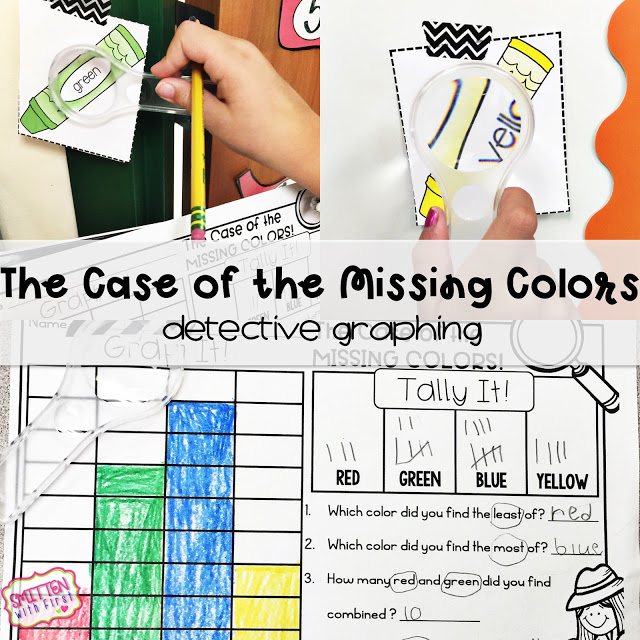
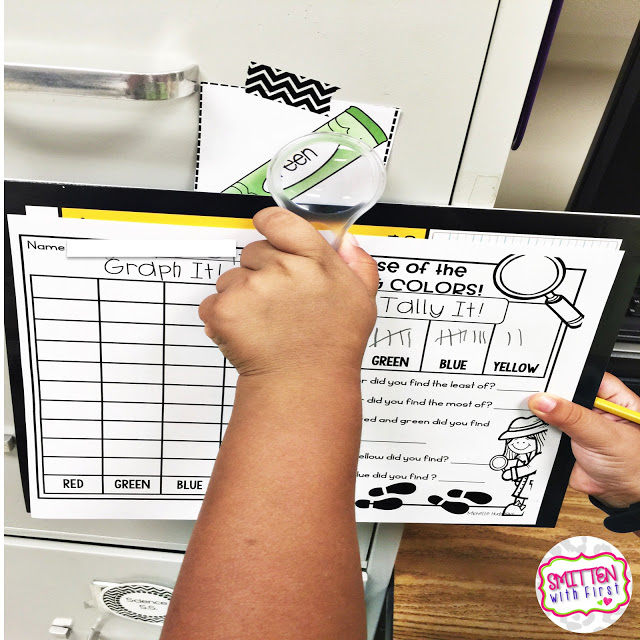
Monday, we started off using our magnifying glasses to find all the missing crayons. You can find magnifying glasses here. I placed these crayon cards all around the room and explained to my students that there was a case of missing crayons that needed to be solved. Of course I added lots of drama to get them super pumped about solving the case.
As they walked around the room finding the missing crayons, they tallied which colors they found.
Then, they used the data from their tally marks to create a bar graph.
Next up, grocery shopping for fruits and vegetables.
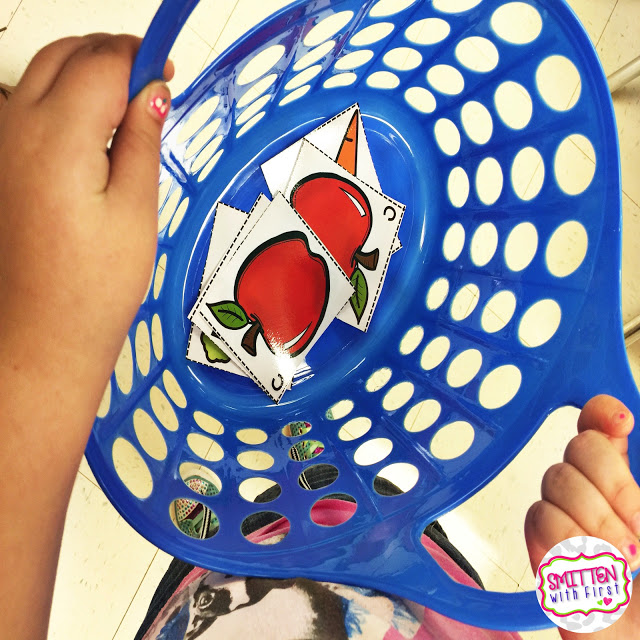
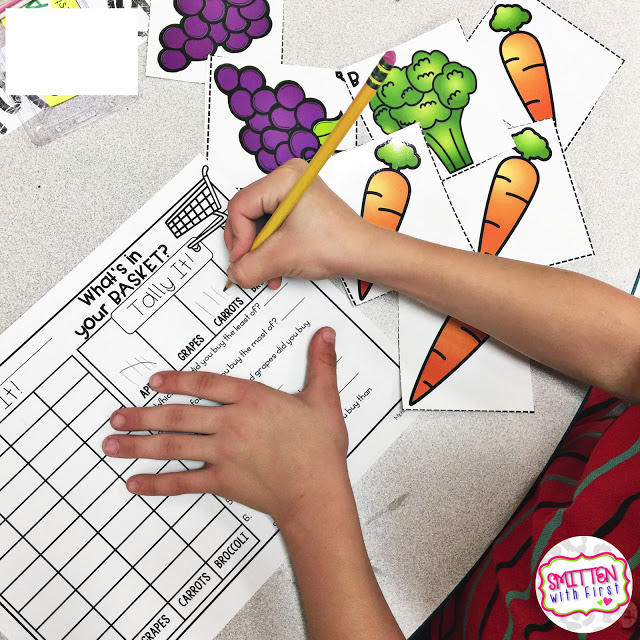
I put my students into table groups (4 students) and assigned each table a letter A through E. I placed these fruit and vegetable cards all around the room and even outside of the room. I gave each group a basket and then sent them on their way to buy up all the fruit and vegetables that had their table’s letter on them.
(I found these baskets at The Dollar Tree)
After they bought their groceries, they tallied the amounts of each fruit and vegetable….
and then used that data to create a bar graph.
At the end of the week we went on a fishing trip. This graph-tivity was lots of fun!
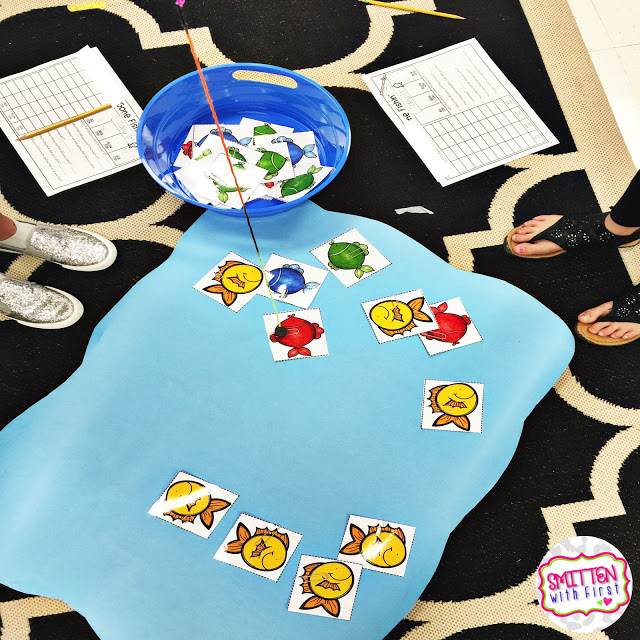
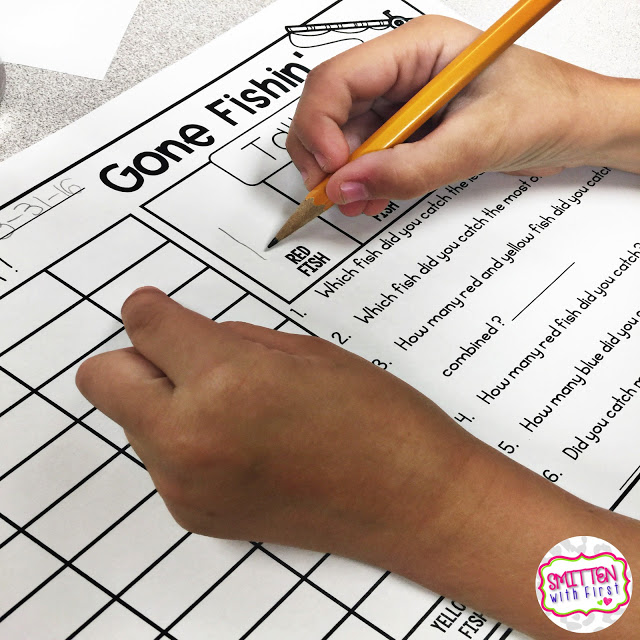
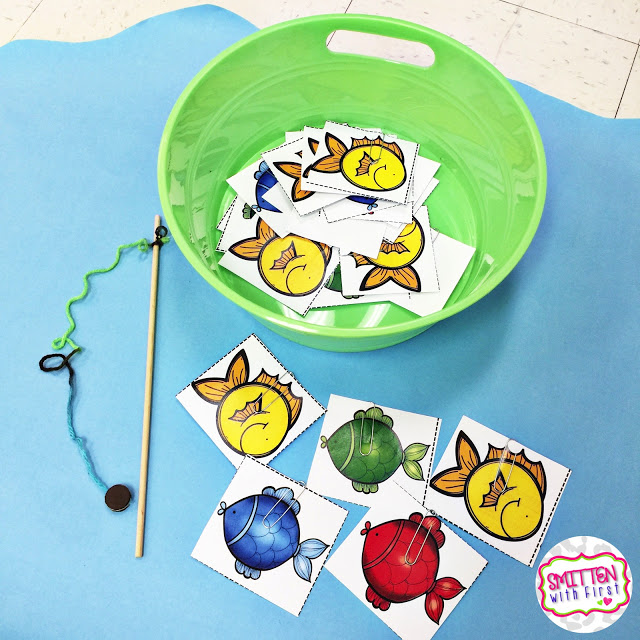
I put my students in table groups and they took turns fishing. They each had their own recording sheet and had to record the color fish that they caught plus the color that the friends in their group caught.
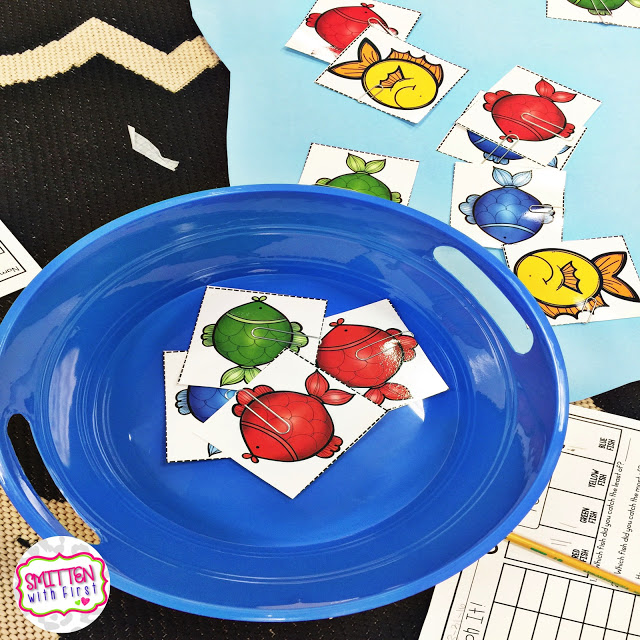
After catching each fish, they had to put the fish in the bucket so that they knew which fish still need to be caught.
After recording their tally marks for the amount of each fish caught; they used that data to fill in their bar graph and answer the graph questions.
(I used small dowel rods from Wal-Mart, yarn, and round magnets to create the fishing poles. I used paper clips as “hooks” to catch the fish.)
To wrap up our learning, we worked in pairs to complete these flip flap books. My students cut and glued the lions and zebras down to the picture graph flap…then, used that data to create a tally graph and bar graph.
Afterwards, they flipped their book over and completed the questions on the back.
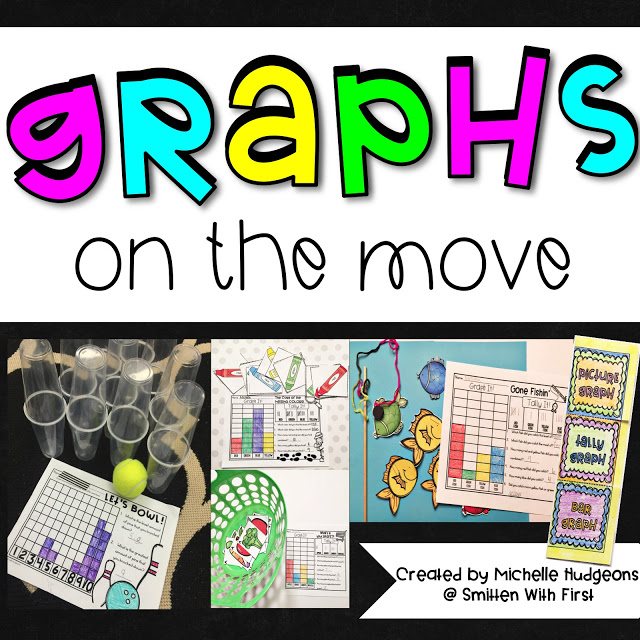
And there you have it….graphing on the move! We had such a blast this week! You can find ALL of the activities above in my Graphs on the Move pack here.
